I was reading through some posts on ASP.NET best practices, and a lot is mentioned about
The biggest area I thought tracing could effect an application was memory, so I wanted to see the memory differences of having trace enabled, vs having it disabled.
Test #1 - Trace enabled
<trace enabled="true" requestlimit="5000" mostrecent="false"></trace>
I loaded up an instance of one of our ASP.NET applications on my machine, and ran a script that generated random hits on a few of the pages.
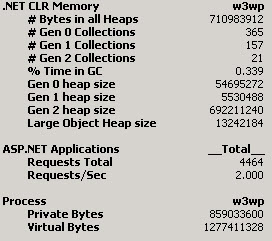
After about ~4500 requests, here is what perfmon read.

Test #2 - No Tracing
<trace enabled="false" requestlimit="5000" mostrecent="false"></trace>
Ran the script again, and saw some pretty interesting results.

The Word
At first, the results look the same, but look closer. With tracing enabled the # of Bytes in all Heaps is 710MB, vs 72MB without tracing. That’s a 10x difference! The Gen 2 heap is where most of the difference lies, which is a whopping 692MB vs 65MB. This heap should only contain very long lived objects. Having a growing Gen 2 heap is also going to indicate the need for IIS to recycle soon, since memory obviously isn’t getting deallocated.
If you are running with
If this graph isn’t making a lot of sense, check out this article on debugging memory problems.